
Eleven observations average 72.73. Ten of them are below 43.
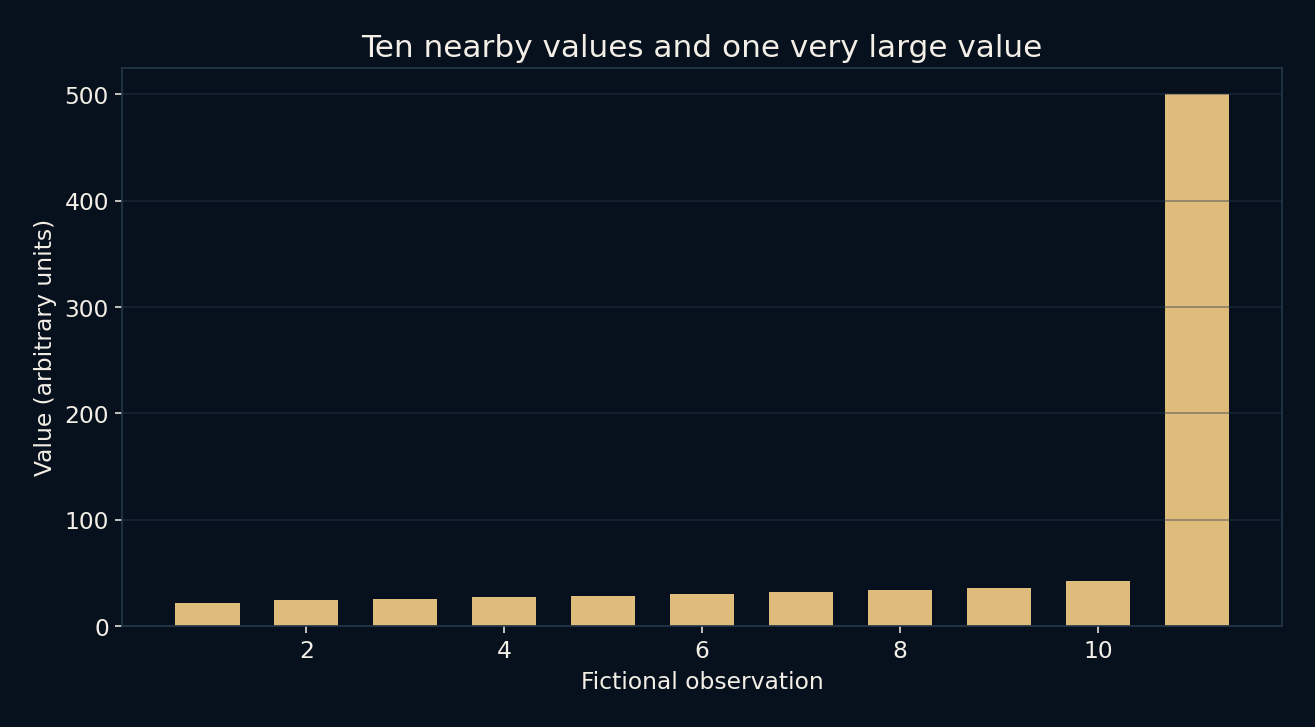
Our fictional list begins quietly: 22, 24, 25, 27, 28, 30, 32, 34, 36 and 42. Then comes 500. These are arbitrary units, not salaries, rents or measurements of people. The contrast is intentional. It lets us watch three familiar summaries respond to exactly the same data, and ask which description would help a reader picture the list.
A summary is a choice about what to preserve.
The balancing point moves
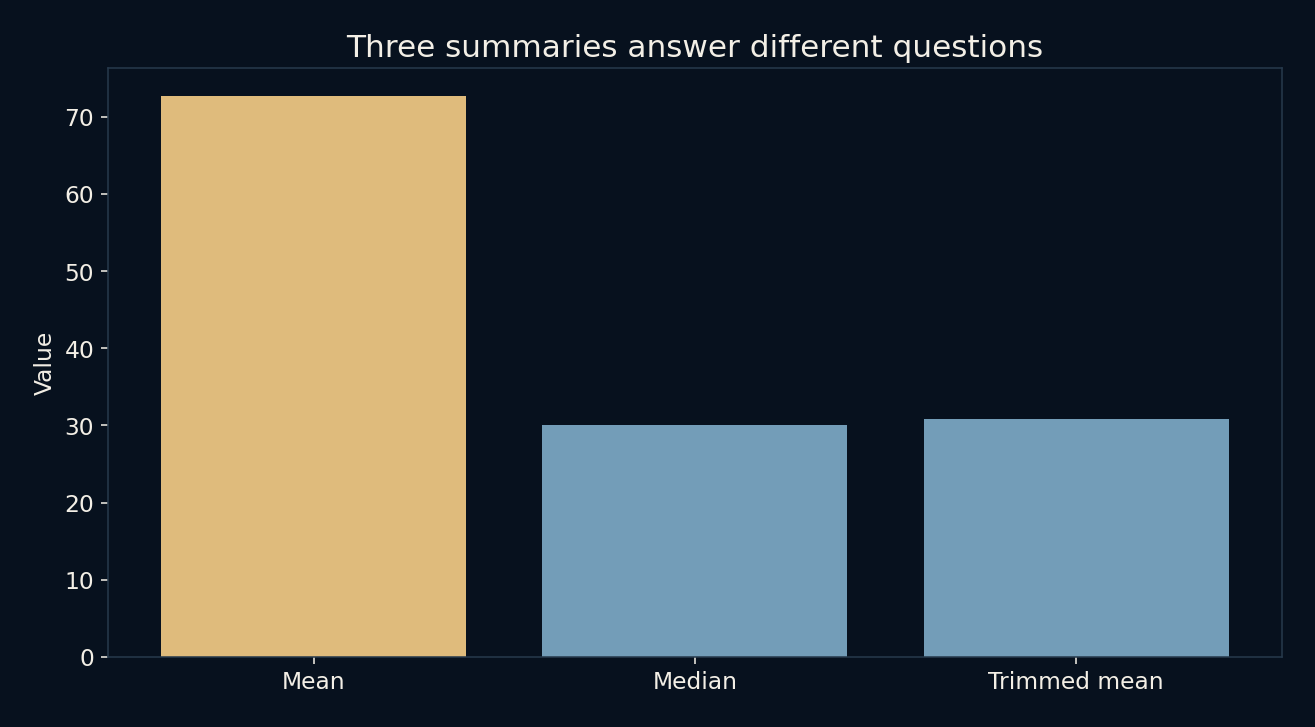
Add all eleven values and the total is 800. Divide by eleven and the arithmetic mean is 72.7273. This familiar calculation preserves the total: eleven equal shares of the mean would add back to 800. That makes it useful for accounting, expected totals and questions about how a quantity is distributed in aggregate.
But none of these observations is close to 72.73. Ten lie between 22 and 42, while the last is 500. Removing that last value leaves a mean of exactly 30 for the first ten. Its influence is not a calculation failure. Large values carry correspondingly large weight in the total, and the mean is designed to retain that information.
Order the list and find the centre
The median asks a different question: where is the middle observation after sorting? With eleven values, the sixth is 30. Five observations are at or below the positions before it and five after it. Changing 500 to 5,000 would leave this median unchanged, provided the order around the centre stayed the same.
That resistance is helpful when describing a typical position in a skewed distribution. It also discards some information deliberately. The median alone cannot distinguish an upper tail ending at 50 from one ending at 5,000. If the total burden or resources matter, that missing distinction may be the most important part of the story.
A trimmed mean makes its rule visible
The experiment also removes exactly one smallest and one largest observation, then averages the remaining nine. Their sum is 278, giving a trimmed mean of 30.8889. This is a symmetric trimming rule chosen in advance for the example. It is not a statistical verdict that 22 and 500 are mistakes.
Trimming can reduce the influence of extreme values while retaining more of the central data than a median. But the amount trimmed is a modeling choice. Dropping values only after seeing an inconvenient result would change the question without honestly labeling the change. A useful report states the rule and keeps access to the untrimmed summary.
Typical and total are different requests
If you wanted a number representing an ordinary position in this list, the median is a more recognizable description of the crowded middle. If you needed to divide the total evenly, the mean gives the correct equal share. Neither task is improved by declaring one statistic universally superior. The intended use determines what should survive compression.
A distribution plot is often the simplest companion to either number. It shows the gap, the cluster and the isolated value that a single summary hides. For real datasets, reporting sample size and spread also helps. Two groups can share a median while having very different tails, or share a mean while having very different typical experiences.
Unusual does not automatically mean invalid
A distant value deserves investigation, not automatic deletion. It could be a typo, a different unit, a separate population or a genuine rare observation. Those possibilities lead to different actions. A corrected unit should be fixed; a valid large observation may need to remain, even when it makes the summary less comfortable.
This constructed list cannot tell us which explanation would apply in a real setting because its 500 was placed there on purpose. Its role is to separate arithmetic from judgment. Before saying that an average person or average case behaves a certain way, check whether the number describes the middle, preserves a total, or is trying to do both at once.
Further reading
NIST: measures of location ↗NumPy: mean ↗NumPy: median ↗Original documentation and useful background.